Thursday, 2 June 2016
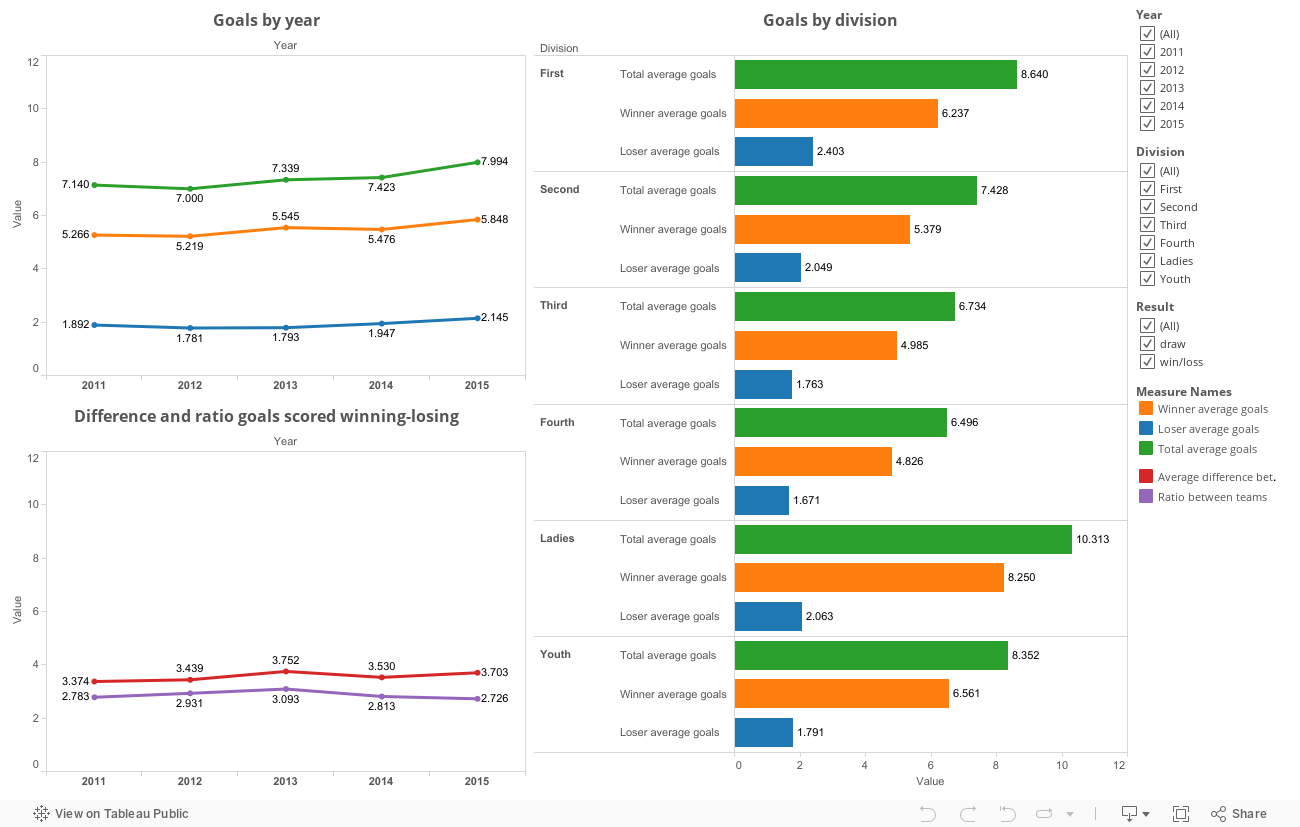
Goals scored in the Dutch national canoe polo competition 2011-2015
Click here for a bigger visualisation of the goals scored in the Dutch canoe polo competition over the last couple of years.
Effective programs to increase your throwing velocity
A quick note beforehand: I've put this together where I had some spare time, so don't expect me to go into full detail. If there any questions, feel free to leave a comment and I will come back to it. Similarly, if you would like to see all underlying data for the analysis in this post, leave a comment and I will see what I can do.
Overarm throwing seems to play an important role in many team sports, for example handball, water polo and of course canoe polo. One study examining an international canoe polo team found players to pass the ball 45 +/- 22 times during the first half and 23 +/- 10 times during the second half. Shots taken were 4 +/- 2 during the first half and 4 +/- 1 during the second half (Forbes et al., 2013). This was with ball possession for 50% of the time, which roughly translates to 7.6 throws per minute. Analysis of my own team revealed an average of 12 shots at goal per game during a whole tournament (in a later post more on this).
There are several components which make a pass or a shot successful. In my opinion the main ones are accuracy, distance, a feint/deceptiveness and velocity. Of course there are many more components, like game awareness, technique, strength, body size, etcetera, but these result in the aforementioned components. In this blog post I will focus on the velocity component, and specifically which training methods may be effective in improving it.
As far as I know no study has shown the importance of throwing velocity, although intuitively it feels important. In theory having a higher throwing velocity would contribute to teams playing at a higher tempo, having greater passing distance and making it more difficult for the goalkeepers plus defenders to stop a shot at goal. From unpublished research in elite teams we know that senior men throw faster than U21 men and that for both these teams playing squad players throw faster than the extended playing squad players. It has to be noted that a similar pattern is present for lean body mass, with the senior men playing squad players having the highest lean body mass and the U21 extended playing squad players having the lowest. This influences throwing velocity as well (van den Tillaar & Ettema, 2004).
Therefore it seems beneficial to try and improve throwing velocity. This could be done by improving technique, but I will focus on the physical training programs.
For this I performed a meta-analysis. In this method you combine studies to get to a more robust conclusion of the actual effect you want to examine and express it in a standardized value so you can compare methods despite different tests/outcome measures/number of participants. For example, it would be possible to compare the effectiveness of a training method for elite sprinters and recreational sprinters. Elite sprinters would probably improve far less than the recreational sprinters, but as their performances differ very little the smallest improvement has a relatively large effect. Similarly, the recreational sprinters would probably improve more, but because their times and the improvements will vary a lot the relative effect will not be as big. Going from 10.2 to 9.8 in a 100-meter race with the competition running between 9.8-10.4 transforms you from a sub-top sprinter to a potential world champion, while going from 13.2 to 12.8 in a field that ranges from 11.6-14.0 hardly makes any difference performance wise.
I'll keep the technical stuff relatively short. I performed a systematic search using an electronic database (Pubmed) with results up to June 2nd 2016. Key words used were “throw AND training”. Articles were included if they had throwing velocity as an outcome measure, used subjects from throwing sports between 18 and 40 years old, were intended to improve throwing velocity and the training program lasted more than three weeks. This eventually resulted in 22 included articles. Interventions were categorized on training method. If the training program used multiple methods these were categorized under a combination category. If they could not really be categorized they were categorized under "other". To compare interventions, effect sizes were calculated between pre- and post tests using Hedges and Olkin’s formula. To determine the effect size of a category the weighted average was calculated using Hedges’s g. Interventions were excluded if the 95% confidence interval of the ES fell outside of weighted average’s 95% confidence interval of the category. If categories existed of one intervention they were put together with their most similar category. 39 interventions were included in the final analysis. See figure 1. An excel file with the exact numbers can be found here.

An explanation of the categories with the number of interventions involved:
- "Throwing (n=5)": a program using throwing exercises with a regular to the sport specific ball. 2.8 training sessions per week for 8.9 weeks, total 26.4 sessions.
- "Weighted throwing (n=4)": a program using throwing exercises using light/regular/heavy balls. 3 sessions per week for 10 weeks, total 30 sessions.
- "Rotator cuff+traditional resistance (n=2)": a program specifically targeting the rotator cuff muscles, complemented by traditional resistance training (6-15 repetitions, no continuous acceleration). 2 sessions per week for 8 weeks, total 16 sessions.
- "Traditional Resistance+plyometric (n=2)": a program using traditional resistance (6-15 repetitions, no continuous acceleration) and plyometric exercises (e.g. clap push-ups, drop jumps). 2 sessions per week for 8 weeks, total 16 sessions.
Weighted throw seemed the most effective method to improve throwing velocity, but results came from the same author and should be confirmed by a different research group. Other likely more effective training methods are traditional resistance+plyometric training, explosive strength(+throw) training and multiple methods combined. The number of sessions for these three methods that result in the effect are very similar, so it does not provide us with an argument to chose one over the other.
From the results it seems that complementing a maximal resistance program with throwing exercises seems a lot more effective than only doing the maximal resistance program. A regular throwing program does not seem to improve performance in already well trained individuals.
A great website on how to interpret effect sizes like the ones I used can be found here.
In conclusion, if you are an experienced throwing athlete you should do more than throwing if you want to improve your throwing velocity. The most effective methods for this are weighted throwing, traditional resistance combined with plyometric training, explosive strength training possibly complemented with throwing exercises, and doing a combination of three or more of the above mentioned methods.
You can find all references used for the meta-analysis with their effect sizes per category in this document.
Other references used
FORBES SC, KENNEDY MD and BELL GJ, 2013. Time-motion analysis, heart rate, and physiological characteristics of international canoe polo athletes. Journal of strength and conditioning research / National Strength & Conditioning Association, 27(10), pp. 2816-22.
VAN DEN TILLAAR, R. and ETTEMA, G., 2004. Effect of body size and gender in overarm throwing performance. European journal of applied physiology, 91(4), pp. 413-418.
Overarm throwing seems to play an important role in many team sports, for example handball, water polo and of course canoe polo. One study examining an international canoe polo team found players to pass the ball 45 +/- 22 times during the first half and 23 +/- 10 times during the second half. Shots taken were 4 +/- 2 during the first half and 4 +/- 1 during the second half (Forbes et al., 2013). This was with ball possession for 50% of the time, which roughly translates to 7.6 throws per minute. Analysis of my own team revealed an average of 12 shots at goal per game during a whole tournament (in a later post more on this).
There are several components which make a pass or a shot successful. In my opinion the main ones are accuracy, distance, a feint/deceptiveness and velocity. Of course there are many more components, like game awareness, technique, strength, body size, etcetera, but these result in the aforementioned components. In this blog post I will focus on the velocity component, and specifically which training methods may be effective in improving it.
As far as I know no study has shown the importance of throwing velocity, although intuitively it feels important. In theory having a higher throwing velocity would contribute to teams playing at a higher tempo, having greater passing distance and making it more difficult for the goalkeepers plus defenders to stop a shot at goal. From unpublished research in elite teams we know that senior men throw faster than U21 men and that for both these teams playing squad players throw faster than the extended playing squad players. It has to be noted that a similar pattern is present for lean body mass, with the senior men playing squad players having the highest lean body mass and the U21 extended playing squad players having the lowest. This influences throwing velocity as well (van den Tillaar & Ettema, 2004).
Therefore it seems beneficial to try and improve throwing velocity. This could be done by improving technique, but I will focus on the physical training programs.
For this I performed a meta-analysis. In this method you combine studies to get to a more robust conclusion of the actual effect you want to examine and express it in a standardized value so you can compare methods despite different tests/outcome measures/number of participants. For example, it would be possible to compare the effectiveness of a training method for elite sprinters and recreational sprinters. Elite sprinters would probably improve far less than the recreational sprinters, but as their performances differ very little the smallest improvement has a relatively large effect. Similarly, the recreational sprinters would probably improve more, but because their times and the improvements will vary a lot the relative effect will not be as big. Going from 10.2 to 9.8 in a 100-meter race with the competition running between 9.8-10.4 transforms you from a sub-top sprinter to a potential world champion, while going from 13.2 to 12.8 in a field that ranges from 11.6-14.0 hardly makes any difference performance wise.
I'll keep the technical stuff relatively short. I performed a systematic search using an electronic database (Pubmed) with results up to June 2nd 2016. Key words used were “throw AND training”. Articles were included if they had throwing velocity as an outcome measure, used subjects from throwing sports between 18 and 40 years old, were intended to improve throwing velocity and the training program lasted more than three weeks. This eventually resulted in 22 included articles. Interventions were categorized on training method. If the training program used multiple methods these were categorized under a combination category. If they could not really be categorized they were categorized under "other". To compare interventions, effect sizes were calculated between pre- and post tests using Hedges and Olkin’s formula. To determine the effect size of a category the weighted average was calculated using Hedges’s g. Interventions were excluded if the 95% confidence interval of the ES fell outside of weighted average’s 95% confidence interval of the category. If categories existed of one intervention they were put together with their most similar category. 39 interventions were included in the final analysis. See figure 1. An excel file with the exact numbers can be found here.

An explanation of the categories with the number of interventions involved:
- "Throwing (n=5)": a program using throwing exercises with a regular to the sport specific ball. 2.8 training sessions per week for 8.9 weeks, total 26.4 sessions.
- "Weighted throwing (n=4)": a program using throwing exercises using light/regular/heavy balls. 3 sessions per week for 10 weeks, total 30 sessions.
- "Rotator cuff+traditional resistance (n=2)": a program specifically targeting the rotator cuff muscles, complemented by traditional resistance training (6-15 repetitions, no continuous acceleration). 2 sessions per week for 8 weeks, total 16 sessions.
- "Traditional Resistance+plyometric (n=2)": a program using traditional resistance (6-15 repetitions, no continuous acceleration) and plyometric exercises (e.g. clap push-ups, drop jumps). 2 sessions per week for 8 weeks, total 16 sessions.
- "Traditional resistance(+throw) (n=2)": a program using either traditional resistance (6-15 repetitions, no continuous acceleration) or traditional resistance supplemented by regular throwing exercises. 3 sessions per week for 12 weeks, total 36 sessions.
- "Explosive strength (+throw) (n=3)": a program using either explosive resistance exercises (olympic lifts/jump squats/bench throw/etcetera, low percentage of 1RM for all except olympic lifts) or explosive resistance exercises complemented by regular throwing exercises. 1.8 sessions per week for 8.9 weeks, total 16 sessions.
- "Maximal resistance (n=7)": a program using maximal strength exercises with no continuous acceleration (weight <=6 repetitions maximum). 3 sessions per week for 8.9 weeks, 25 sessions in total.
- "Maximal resistance+throw (n=3)": a program using maximal strength exercises with no continuous acceleration (weight <=6 repetitions maximum) complemented with regular throwing exercises. 2.8 sessions per week for 7.5 weeks, total 21.7 sessions.
- "plyometric (n=3)": a program using plyometric exercises (e.g. clap push-ups, drop jumps). 1.6 sessions per week for 6.7 weeks, total 17.3 sessions.
- "plyometric+throw (n=2)": a program using plyometric exercises (e.g. clap push-ups, drop jumps) complemented with regular throwing exercises. 2 sessions per week for 8 weeks, total 16 sessions.
- "Core training (n=3)": A program using exercises that teach to stabilize the core/one's posture while resisting the force generated in the exercise. 2.2 sessions per week for 7.5 weeks, total 14.9 sessions.
- "Multiple (n=3)": A program involving plyometric, explosive resistance, traditional resistance and resistance increased sport specific exercises. 3 sessions per week for 6 weeks, 18 sessions in total.
- "AllInt (n=39)": All interventions combined.
From the results it seems that complementing a maximal resistance program with throwing exercises seems a lot more effective than only doing the maximal resistance program. A regular throwing program does not seem to improve performance in already well trained individuals.
A great website on how to interpret effect sizes like the ones I used can be found here.
In conclusion, if you are an experienced throwing athlete you should do more than throwing if you want to improve your throwing velocity. The most effective methods for this are weighted throwing, traditional resistance combined with plyometric training, explosive strength training possibly complemented with throwing exercises, and doing a combination of three or more of the above mentioned methods.
You can find all references used for the meta-analysis with their effect sizes per category in this document.
Other references used
FORBES SC, KENNEDY MD and BELL GJ, 2013. Time-motion analysis, heart rate, and physiological characteristics of international canoe polo athletes. Journal of strength and conditioning research / National Strength & Conditioning Association, 27(10), pp. 2816-22.
VAN DEN TILLAAR, R. and ETTEMA, G., 2004. Effect of body size and gender in overarm throwing performance. European journal of applied physiology, 91(4), pp. 413-418.
Saturday, 25 July 2015
The Interval Shuttle Paddle Test
It has been a very long time since I've written something over here. I'm giving it another go to get some writing experience, so any feedback is welcome!
Some subjects that will get their own post soon are:
Some subjects that will get their own post soon are:
- Training methods to improve your throwing velocity
- Trends in goals scored across different levels in the Dutch national league
- Possibilities to program your (assisted/resisted) sprints
But first, lets talk about the interval shuttle paddle test (ISPT), how we developed it and why it should be used.
ISPT
This is an endurance test similar to the more well known BEEP test and is adapted specifically for canoe polo. Links to the full protocol and sound file can be found at the end of this post.
We developed the ISPT to have a canoe specific test that would measure endurance capacity while also taking into account the intermittent character of canoe polo. A similar intermittent test for football was shown to have more discriminative power for playing level in football than a non-intermittent version. (Lemmink et al., 2004) This test developed by Lemmink et al. is where our ISPT is based on.
During the ISPT an athlete paddles back and forth between two lines, which are 16 meters apart, with the goal of paddling as many shuttles as possible. Shuttles are synchronized to a sound signal to determine the speed the athlete has to paddle at and are subdivided in stages. Each stage the speed is increased, making it harder to reach the opposite line before the sound signal. To simulate the intermittent character of canoe polo while still testing endurance there is a 15 second rest period after approximately 30 seconds of paddling. Each stage has two of these periods.
The decision to use 16 meters was made based on several factors. We first tried modifying the protocol by Lemmink et al. by dividing the distance between the lines by two, effectively making the speed half of what is used in football. After a trial we came to the conclusion turning was too much of a limiting factor, therefore needing to increase the distance. As we also used a 16 meter sprint test, based on the distance needed for your body to reach the ball at the starting sprint, we decided to test that distance next. During trial this distance felt like keeping the turning, stopping and accelerating character of canoe polo while decreasing the limiting factor of these. Using the same distance for multiple tests decreased the set-up time greatly, which made us decide not to trial longer distances.
During this last trial it was noticed by several athletes that the speed increased too much each stage, making athletes drop out before they felt they were getting tired. To counter this we decreased the speed increment. Feedback on this adaptation was positive and most athletes now dropped out because their arms/torso became too tired or they were completely out of breath. This was our last trial. During the first official ISPT measurement the heart-rate of all athletes participating rose steadily to an average of 194±11, suggesting speed increments were low enough to not lead to disproportional increases in effort and making it possible to reach maximum effort based on the theoretical maximum heart-rate of the athletes.
So why would you want to test endurance capacity? Unfortunately not much research has been done on the relation between endurance tests, or even performance tests in general, and their relation with on-field performance. By experience one would say having a good endurance capacity is important to sustain effort during a match and a tournament, with bad endurance leading to exorbitant tiredness, not being able to put in effort, decreased accuracy and (more) muscle soreness after the tournament. To my knowledge Rampinini et al (2007) have one of the few articles looking at the relation between performance tests and on-field performance, while being the only one looking at an incremental endurance test. They found significant correlations between performance on their incremental endurance test and the following on-field measurements: total running distance, high-intensity running distance run and very high-intensity running distance. This suggests having a good endurance capacity and performing well on an endurance test would translate to an athlete being able to put more effort into a match and possibly tournament.
Testing is also important to measure the effectiveness of one's training program, if someone's over-training or if one has reached an endurance level where it is more effective to put the extra time in working on different aspects.
ISPT protocol
ISPT sound file
What would be a good score to achieve? Unfortunately we don't have much data to go on, but a rough guideline for international men standard would be:
- Average = 92 shuttles (complete stage 15)
- Good = 100 shuttles (complete stage 16)
- Excellent = 110+ shuttles (complete stage 17)
References
Lemmink, K. A., Verheijen, R., & Visscher, C. (2004). The discriminative power of the interval shuttle run test and the maximal multistage shuttle run test for playing level of soccer. The Journal of Sports Medicine and Physical Fitness, 44(3), 233-239.
Rampinini, E., Bishop, D., Marcora, S. M., Ferrari Bravo, D., Sassi, R., & Impellizzeri, F. M. (2007). Validity of simple field tests as indicators of match-related physical performance in top-level professional soccer players. International Journal of Sports Medicine, 28(3), 228-235. doi:10.1055/s-2006-924340 [doi]
Friday, 20 January 2012
Exploring the game of canoepolo
Of course we all have an understanding
of how canoepolo is played, since we play this game. There are some
websites and books that describe tactics and most of us have some
ideas about tactics ourselves. This is enough to start practicing,
but your view will always be from your own position.
One step further is having a coach.
Someone who can look at the game from the side, that way having a
better view of what the whole team is doing and can also see what the
individual does. This person can give tips on how to perform better
and point out the things that went well. Problem is you can't see
everything and also can't remember everything, so your mind starts
filling gaps with what you expect had happened. You can't just go
back in your memory when you missed something or to have a better
look at it, that isn't how our memories work. Every time we recall a
memory there is something we've forgotten, so we just make up
something without really noticing or we don't notice at all. This website gives some
excellent examples with videos of how bad our memory really is. Next
video is also great:
So to counter this effect the next thing we do is add a camera. This way we can watch matches and situations over and over without the danger of distortion. We can even analyze what went good and what needs to be improved. This might sound like you have everything you need, but this still has some limitations. You still watch the match with certain expectations and when something doesn't go wrong or isn't very obvious you might still miss it. An example of this is the movie/book moneyball, based on the story of some people in baseball using different statistics than were used traditionally and this way changing the way people looked at the game. You can read another example in the article “Can irrational decisions be corrected? A football case study” by Jonah Lehrer.
This brings us to a couple of things I
want to do this season. I really want to how canoepolo works. How are
people involved in play? Do some people tend to pass more to each
other or more from certain positions? What happens to the amount of
passes and positional play if we change tactics or instructions? And
more. So I thought that I would make a list with questions and put it
online so other people can come up with some more.
The first question is most important for me at the moment, because this influences the way we teach the game. Allowing children/beginners who start canoepolo to have more ball touches and be more involved in play would be a great achievement.
After reading this, does anyone have any ideas, suggestion or feedback? Maybe someone wants to do some tests themselves and report them later? Would be great if we can share knowledge this way and improve the game of canoepolo. I will write about this again when I have gathered the data.
So to counter this effect the next thing we do is add a camera. This way we can watch matches and situations over and over without the danger of distortion. We can even analyze what went good and what needs to be improved. This might sound like you have everything you need, but this still has some limitations. You still watch the match with certain expectations and when something doesn't go wrong or isn't very obvious you might still miss it. An example of this is the movie/book moneyball, based on the story of some people in baseball using different statistics than were used traditionally and this way changing the way people looked at the game. You can read another example in the article “Can irrational decisions be corrected? A football case study” by Jonah Lehrer.
- How does a smaller pitch influence the amount of passes? Other sports use small sided games to increase the number of ball touches someone has (or movements someone makes), so ball handling in game situations improves. It is also said to increase game awareness because of more involvement in play of everyone. If this is also the case for canoepolo we need to incorporate this in our youth training or even let youth play on a smaller pitch/with less players.
- What is the effect of different tactics on the amount of passes? And does this result in more/less ball losses, more/less goals etc.? This of course is very hard, as the quality of the opposition is an important variable influencing these results.
- What tendencies do our players have considering position and other players they pass to?
- From which positions do we take shots at goal and at which success rate? How many times do we pass before an attempt at goal and does our success rate improve or decline after more passes? Same for our opponents, basically answering the question if our defense can perform like a brick wall or we need to get the ball fast.
- What influence do the amount of substitutions have on this? A hard question to answer as well. If you could you would want to see if the work your team does changes with the amount of substitutions per minute. You need GPS data and pressure sensors in paddles for this if you want to have some certainty. But you can count sprints by hand to get a rough estimation. Influence on the amount of passes and position is easier.
The first question is most important for me at the moment, because this influences the way we teach the game. Allowing children/beginners who start canoepolo to have more ball touches and be more involved in play would be a great achievement.
After reading this, does anyone have any ideas, suggestion or feedback? Maybe someone wants to do some tests themselves and report them later? Would be great if we can share knowledge this way and improve the game of canoepolo. I will write about this again when I have gathered the data.
Sunday, 15 January 2012
Throwing fast is not key
Recently I read this article: Hitting ABaseball – “The Hardest Thing To Do In Sports”
.
In it they describe the steps it takes to hit a baseball, how much
time each step takes and why it's so hard to hit.
In canoepolo we aren't trying to hit a
ball like in baseball, but our goalkeepers are trying to stop it
getting into their goal. This got me thinking what a throw at goal
needs to be successful.
Ofcourse one part of the equation is speed. The faster you throw a ball, the harder it is to stop. If we take the numbers in the above mentioned article for granted, we would need a throw in which the ball takes less than 0.25 seconds so the goalkeeper can't react or just barely. If our throw takes longer the goalkeeper will see the ball coming and the chance of stopping it will increase. So the next thing we need to know is how hard we can throw. I don't know of any numbers for the canoepolo throw, but I found this article article about elite male water polo players. The throwing speeds varied between 21.0 and 29.8 m/s, with an average of 25.3 m/s. Now we have this average we can look within what distance we want to throw. From the point of release to the goal the ball will cover 6.3 meters in 0.25 seconds. Taking the point of release at 1 meter so the ball has to travel 1.5 meter upwards on average, the distance from the goalkeeper we need is 6.11 meters to be within his reaction time. Keep in mind this is for ELITE water polo players, these guys throw hard. If you don't have a feeling for what 25.3 m/s, it's about 91 km/h. Is your throw let's say 15 m/s (54 km/h), the distance you want to be within shrinks to 3.4 meters. That's not even taking into account some goalkeepers may react faster.
So how is it possible we can still stop a ball although the travel time of the ball takes less than our reaction time? That's where things get interesting and we get to the second part of the equation.
Something we all do, most of the time unconsciously, is predicting what someone else might do or what might happen. When you walk through a crowded street you don't bump into people or at least I hope you don't. We look at each other and predict what the other person might do based on their previous movement, where they're looking, their body positioning etc. The same thing happens in sports. We look at our opponent and try to predict what he/she might do. The better you are at this, the sooner you can react. In some sports players/coaches scout their opponents before a match and try to find out which tendencies they have so they can react on things before they happen, winning valuable time for themselves. There are also quite a lot of researcher busy to find out what makes a person good at predicting what someone might do, for example what goalkeepers look at before stopping penalties in football. For this example it was found that the better goalkeepers tend to have similar gazing behavior and there are training programs to improve this behavior.
This has some implications for the way we train and play the game.
An example of an exercise that incorporates this and can be used in a warm up is as follows: Player A has the ball with player B across of him. Player C starts to paddle from player B towards player A. Player A has to pass the ball in an almost straight line to player B before player C reaches him while player C also tries to intercept the pass. When the pass is made player A starts to paddle towards player B and the same as above happens again.
Of course there are a lot of exercises that can be used. Just shooting at goal is another way to do it.
The team I coach has their first tournament of the year tomorrow. As it's a developing team I've given them the instruction to try to only throw the ball from within 3 meters of the opponents goalkeeper and only from further away when there isn't a goalkeeper. This instruction is for two reasons. One is limiting the time the goalkeeper has. Second is they need to learn to create opportunities, by adding this constraint I hope they'll start thinking how to open up the opponent's defense and become more patient in attack. We'll see how it goes!
If you have anything to add, have questions or don't agree with something written here don't hesitate to respond. I love to hear your ideas, training methods and feedback.
Ofcourse one part of the equation is speed. The faster you throw a ball, the harder it is to stop. If we take the numbers in the above mentioned article for granted, we would need a throw in which the ball takes less than 0.25 seconds so the goalkeeper can't react or just barely. If our throw takes longer the goalkeeper will see the ball coming and the chance of stopping it will increase. So the next thing we need to know is how hard we can throw. I don't know of any numbers for the canoepolo throw, but I found this article article about elite male water polo players. The throwing speeds varied between 21.0 and 29.8 m/s, with an average of 25.3 m/s. Now we have this average we can look within what distance we want to throw. From the point of release to the goal the ball will cover 6.3 meters in 0.25 seconds. Taking the point of release at 1 meter so the ball has to travel 1.5 meter upwards on average, the distance from the goalkeeper we need is 6.11 meters to be within his reaction time. Keep in mind this is for ELITE water polo players, these guys throw hard. If you don't have a feeling for what 25.3 m/s, it's about 91 km/h. Is your throw let's say 15 m/s (54 km/h), the distance you want to be within shrinks to 3.4 meters. That's not even taking into account some goalkeepers may react faster.
So how is it possible we can still stop a ball although the travel time of the ball takes less than our reaction time? That's where things get interesting and we get to the second part of the equation.
Something we all do, most of the time unconsciously, is predicting what someone else might do or what might happen. When you walk through a crowded street you don't bump into people or at least I hope you don't. We look at each other and predict what the other person might do based on their previous movement, where they're looking, their body positioning etc. The same thing happens in sports. We look at our opponent and try to predict what he/she might do. The better you are at this, the sooner you can react. In some sports players/coaches scout their opponents before a match and try to find out which tendencies they have so they can react on things before they happen, winning valuable time for themselves. There are also quite a lot of researcher busy to find out what makes a person good at predicting what someone might do, for example what goalkeepers look at before stopping penalties in football. For this example it was found that the better goalkeepers tend to have similar gazing behavior and there are training programs to improve this behavior.
This has some implications for the way we train and play the game.
- The obvious one is don't try to throw at goal from 6+ meters too often with a good goalkeeper at goal, he will even have time to react when he didn't see you throw.
- For goalkeepers a part of their training should be trying to predict shots. This can be useful for players for intercepting passes as well.
- Try to camouflage your throw. If someone can't predict where you're throwing, they can't react as fast.
An example of an exercise that incorporates this and can be used in a warm up is as follows: Player A has the ball with player B across of him. Player C starts to paddle from player B towards player A. Player A has to pass the ball in an almost straight line to player B before player C reaches him while player C also tries to intercept the pass. When the pass is made player A starts to paddle towards player B and the same as above happens again.
Of course there are a lot of exercises that can be used. Just shooting at goal is another way to do it.
The team I coach has their first tournament of the year tomorrow. As it's a developing team I've given them the instruction to try to only throw the ball from within 3 meters of the opponents goalkeeper and only from further away when there isn't a goalkeeper. This instruction is for two reasons. One is limiting the time the goalkeeper has. Second is they need to learn to create opportunities, by adding this constraint I hope they'll start thinking how to open up the opponent's defense and become more patient in attack. We'll see how it goes!
If you have anything to add, have questions or don't agree with something written here don't hesitate to respond. I love to hear your ideas, training methods and feedback.
Subscribe to:
Posts (Atom)